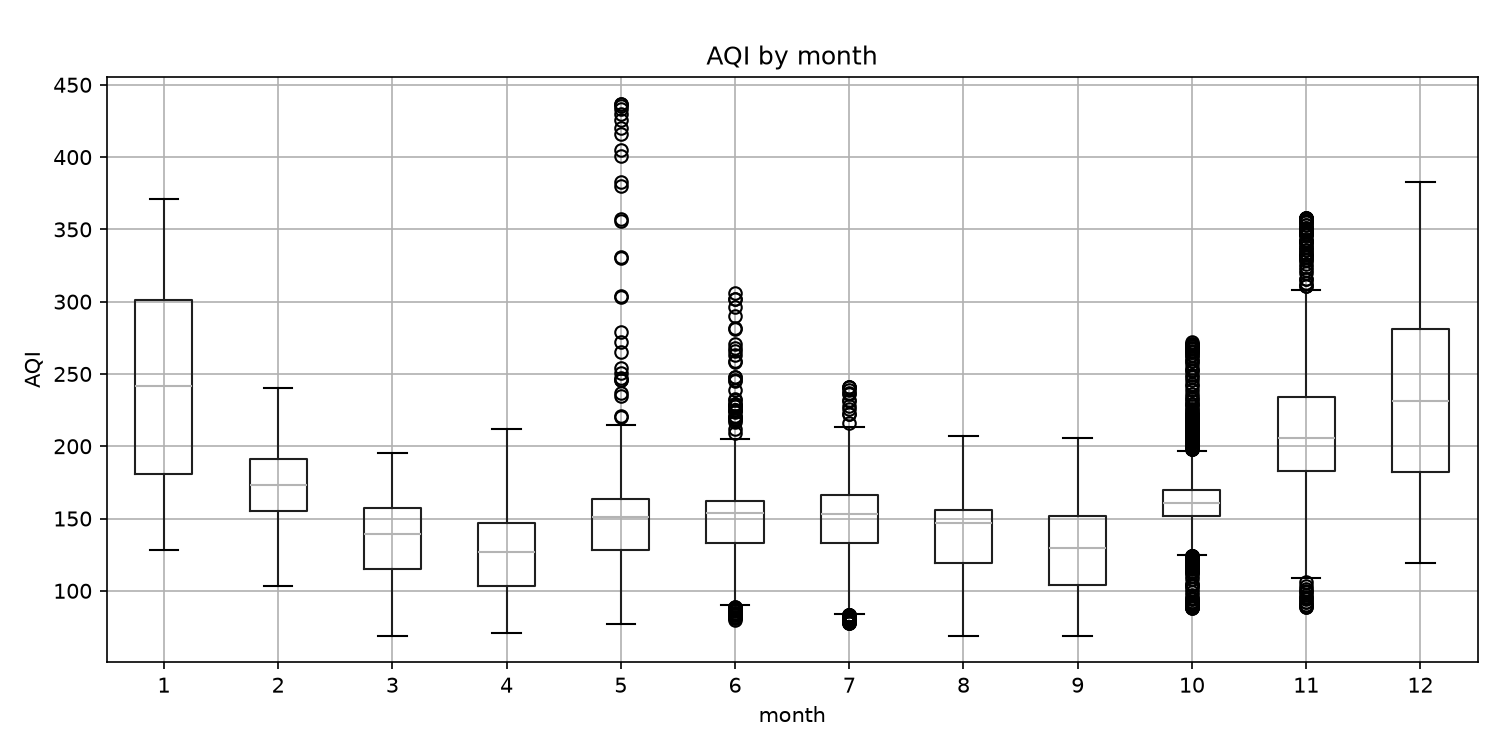
The monthly distribution shows the highest median AQI and widest spread in November, December, and January. Winter pollution is not a single spike: it is a recurring seasonal regime consistent with industrial emissions and crop-burning conditions.
AQI distribution by month
02
The air is volatile by nature.
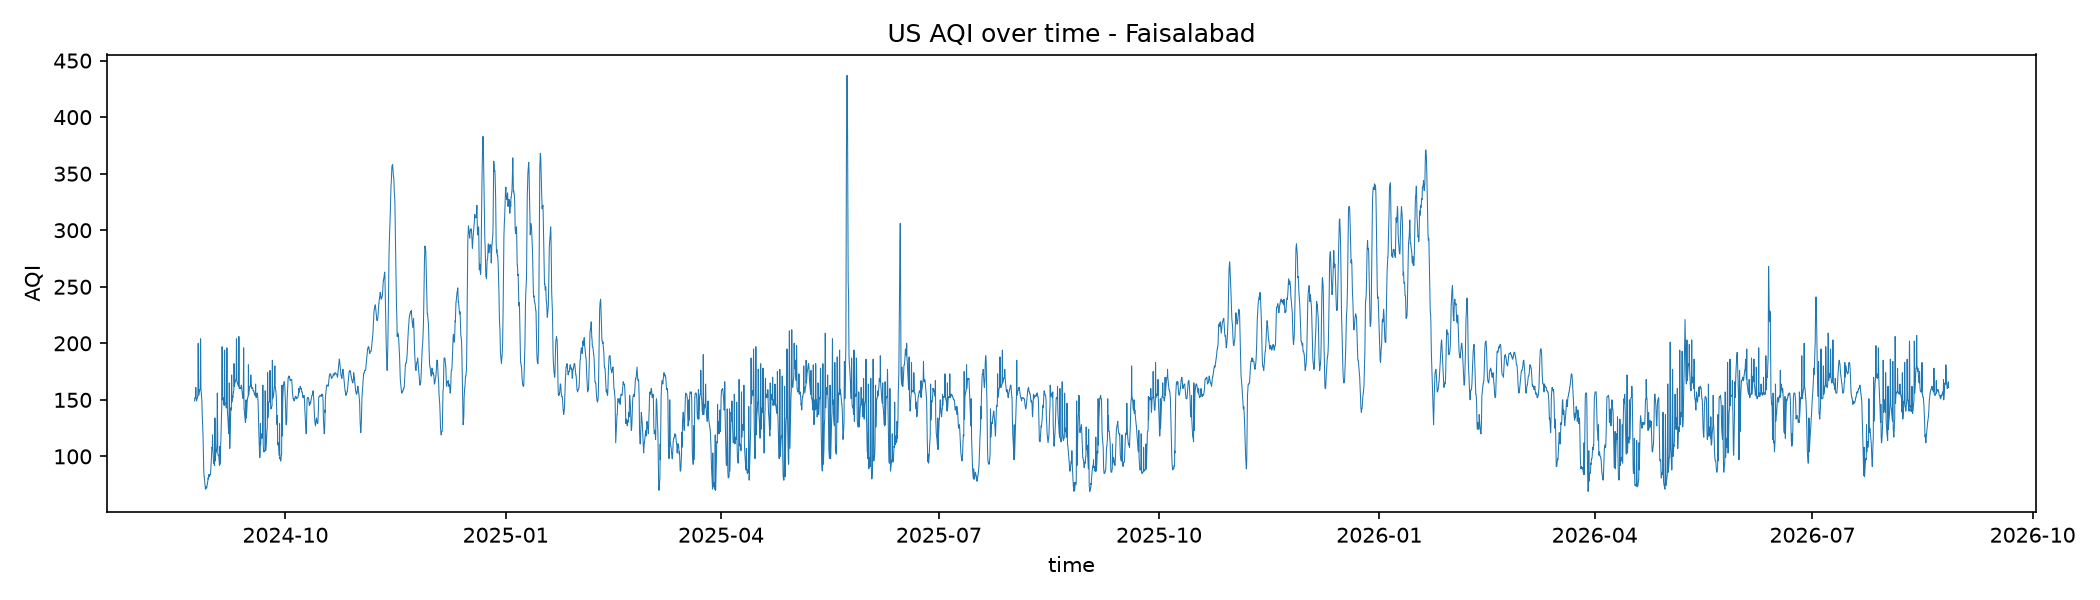
The long series makes the operational challenge visible: quiet periods can shift into sharp pollution episodes. This is why a chronological split and rolling cross-validation matter more than a convenient random split.
US AQI over the observed period
03
Performance, honestly read
HorizonModelMAER²Baseline MAEBaseline R²
24hCatBoost (tuned)14.040.38517.31−0.046
48hCatBoost (tuned)19.500.11921.78−0.656
72hCatBoost (tuned)19.880.14421.83−0.756
CV mean is the metric of record. The held-out summer test window was unusually calm, so its more flattering R² should not be treated as the general expectation.
04
Recent history leads the model.
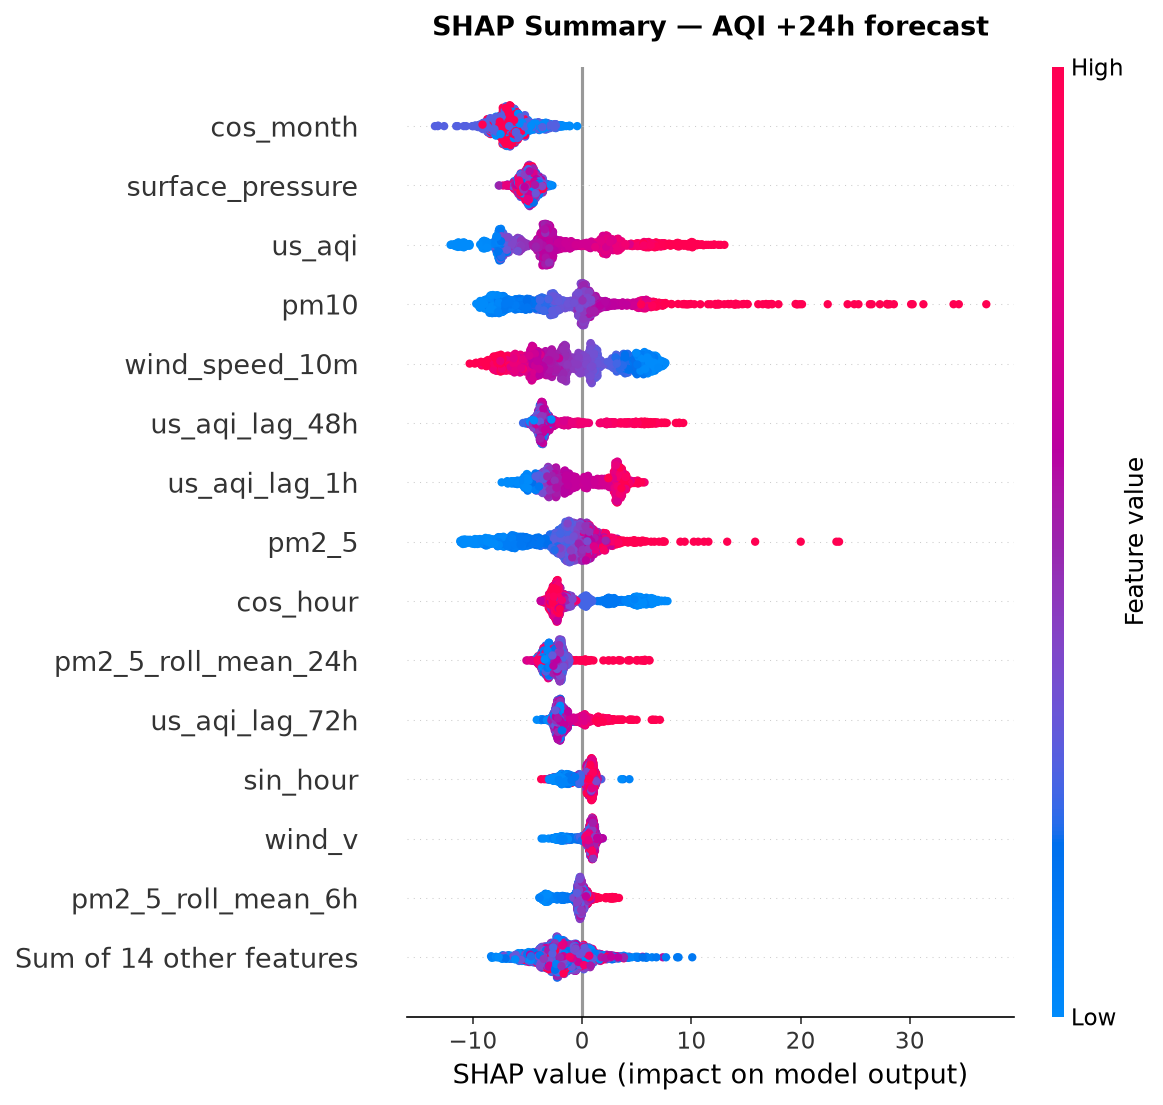
Recent history and environment lead the model. SHAP shows that seasonality, surface pressure, current AQI, PM10, and wind speed carry the strongest influence, with additional contributions from AQI lags and rolling averages. The model is learning persistence plus weather context, not inventing a hidden cause.
SHAP summary, AQI +24h
05
PM2.5 shapes the 24-hour horizon.
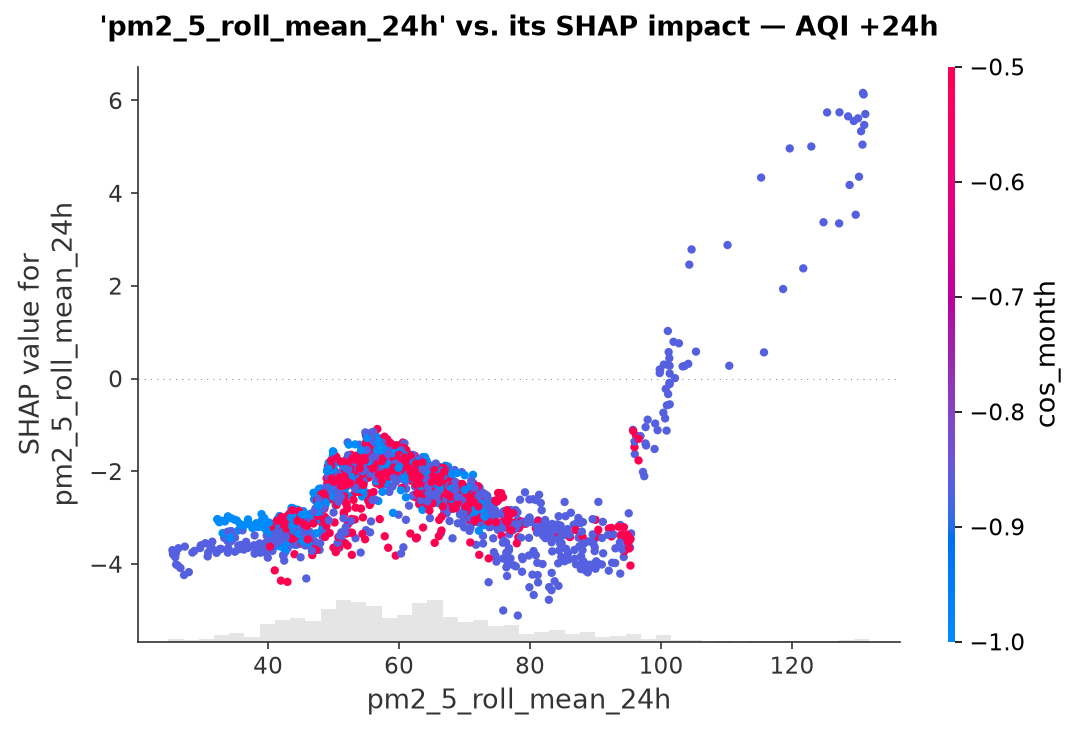
The dependence plot shows how the 24-hour model responds to the rolling PM2.5 average. Higher recent particulate levels generally push the forecast upward, while the spread of SHAP values shows that the effect changes with the surrounding weather and seasonal context.
SHAP dependence, rolling PM2.5 average vs. AQI +24h
06
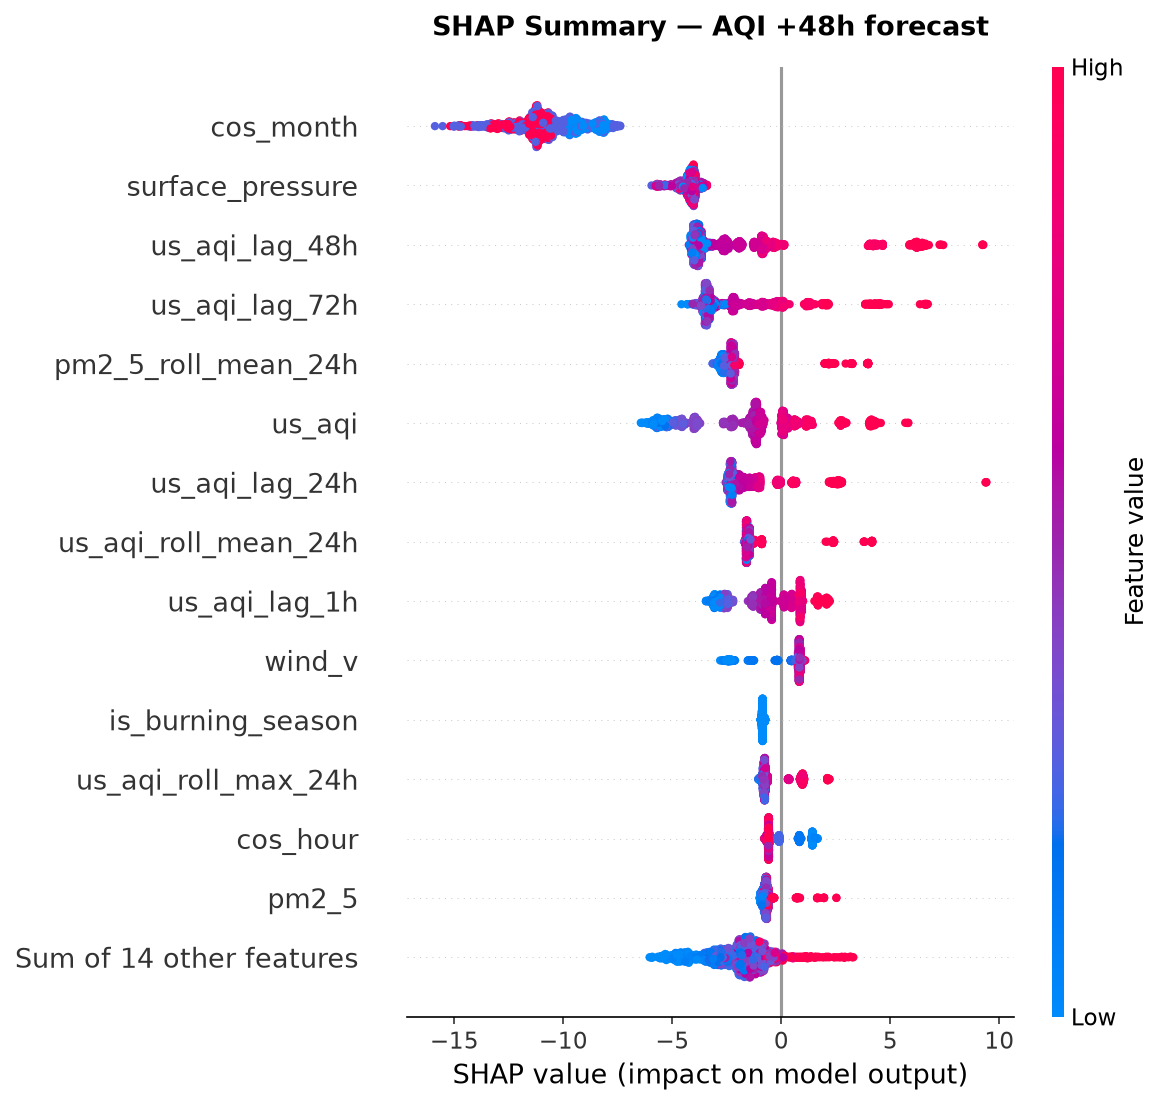
The 48-hour forecast leans on persistence.
At the 48-hour horizon, seasonality and surface pressure remain influential, while recent AQI lags provide the strongest direct signal. The positive SHAP values for higher lagged AQI show how the model carries current pollution conditions into the next two days.
SHAP summary, AQI +48h
07
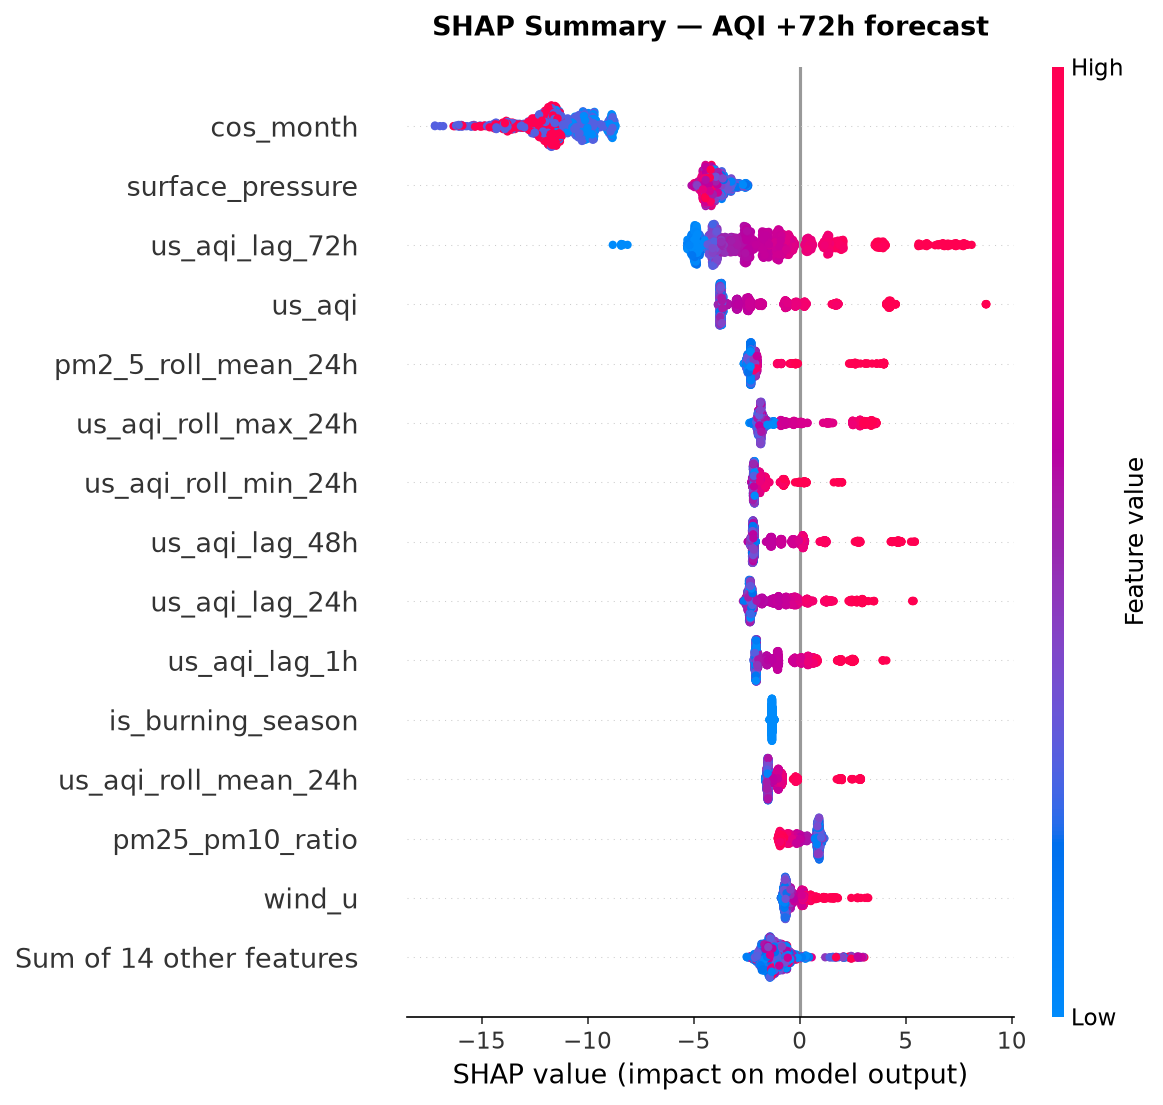
The 72-hour signal is still weather-aware.
Three days ahead, the model continues to use recent AQI history alongside seasonality and surface pressure. The wider distribution of SHAP values reflects a harder forecast: the farther the horizon, the more the prediction depends on how weather and persistence interact.
SHAP summary, AQI +72h
08
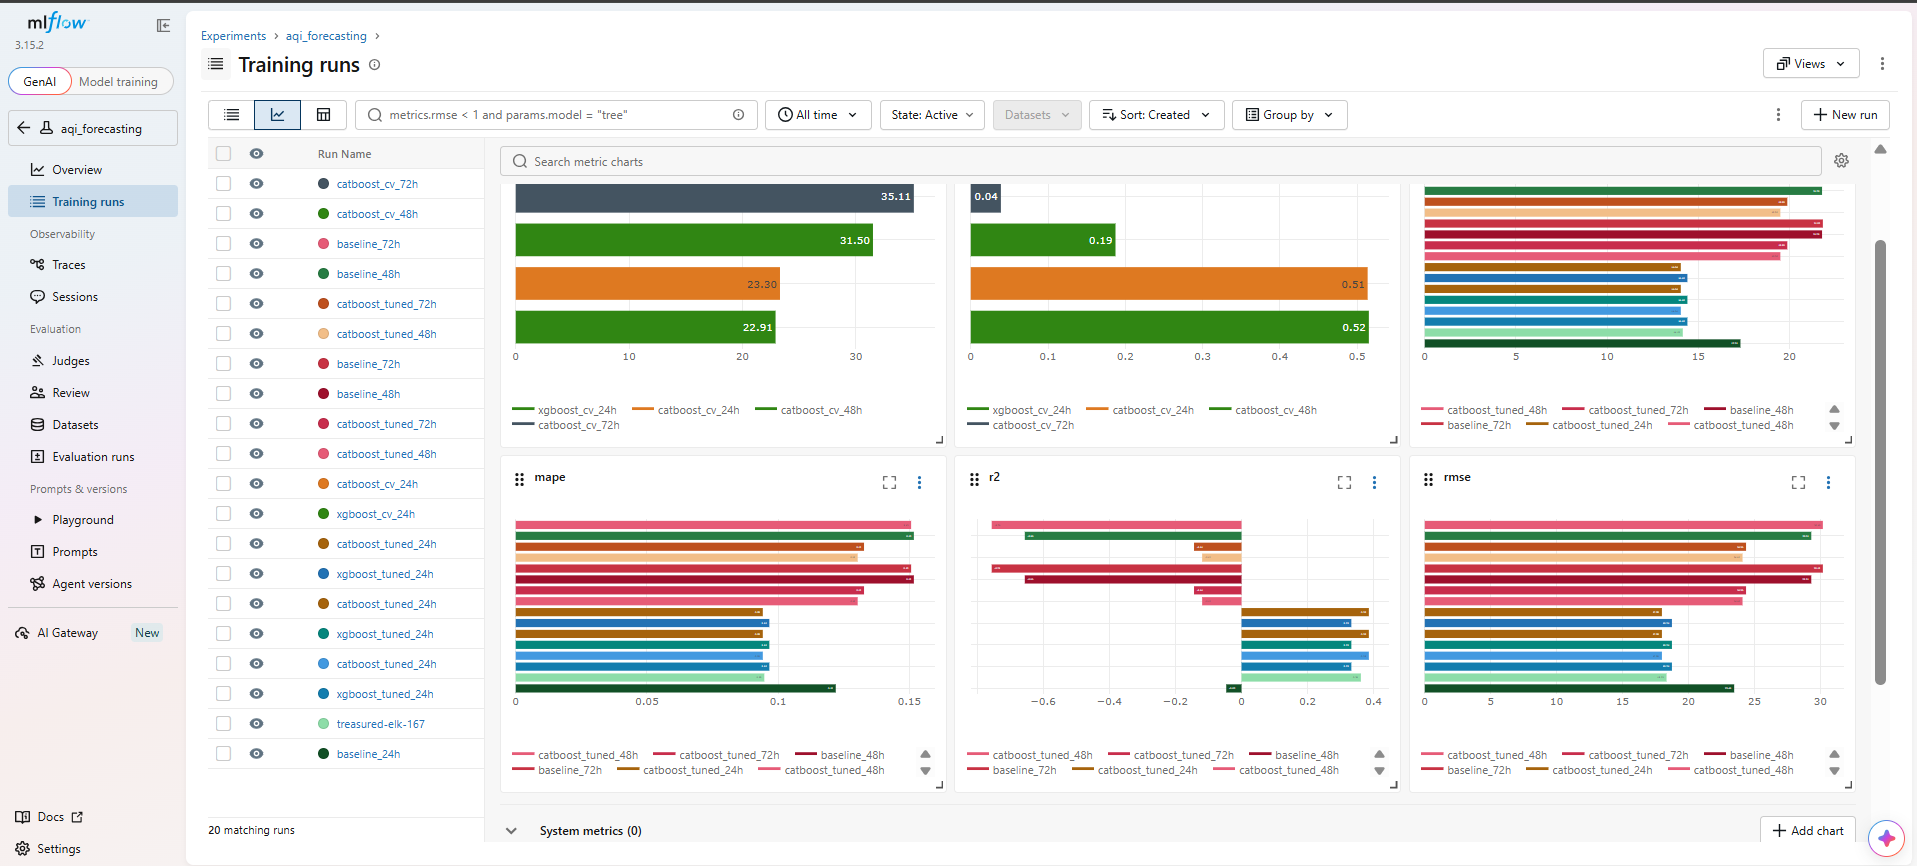
Experiment Tracking
ML Flow used for experiment Tracking
09
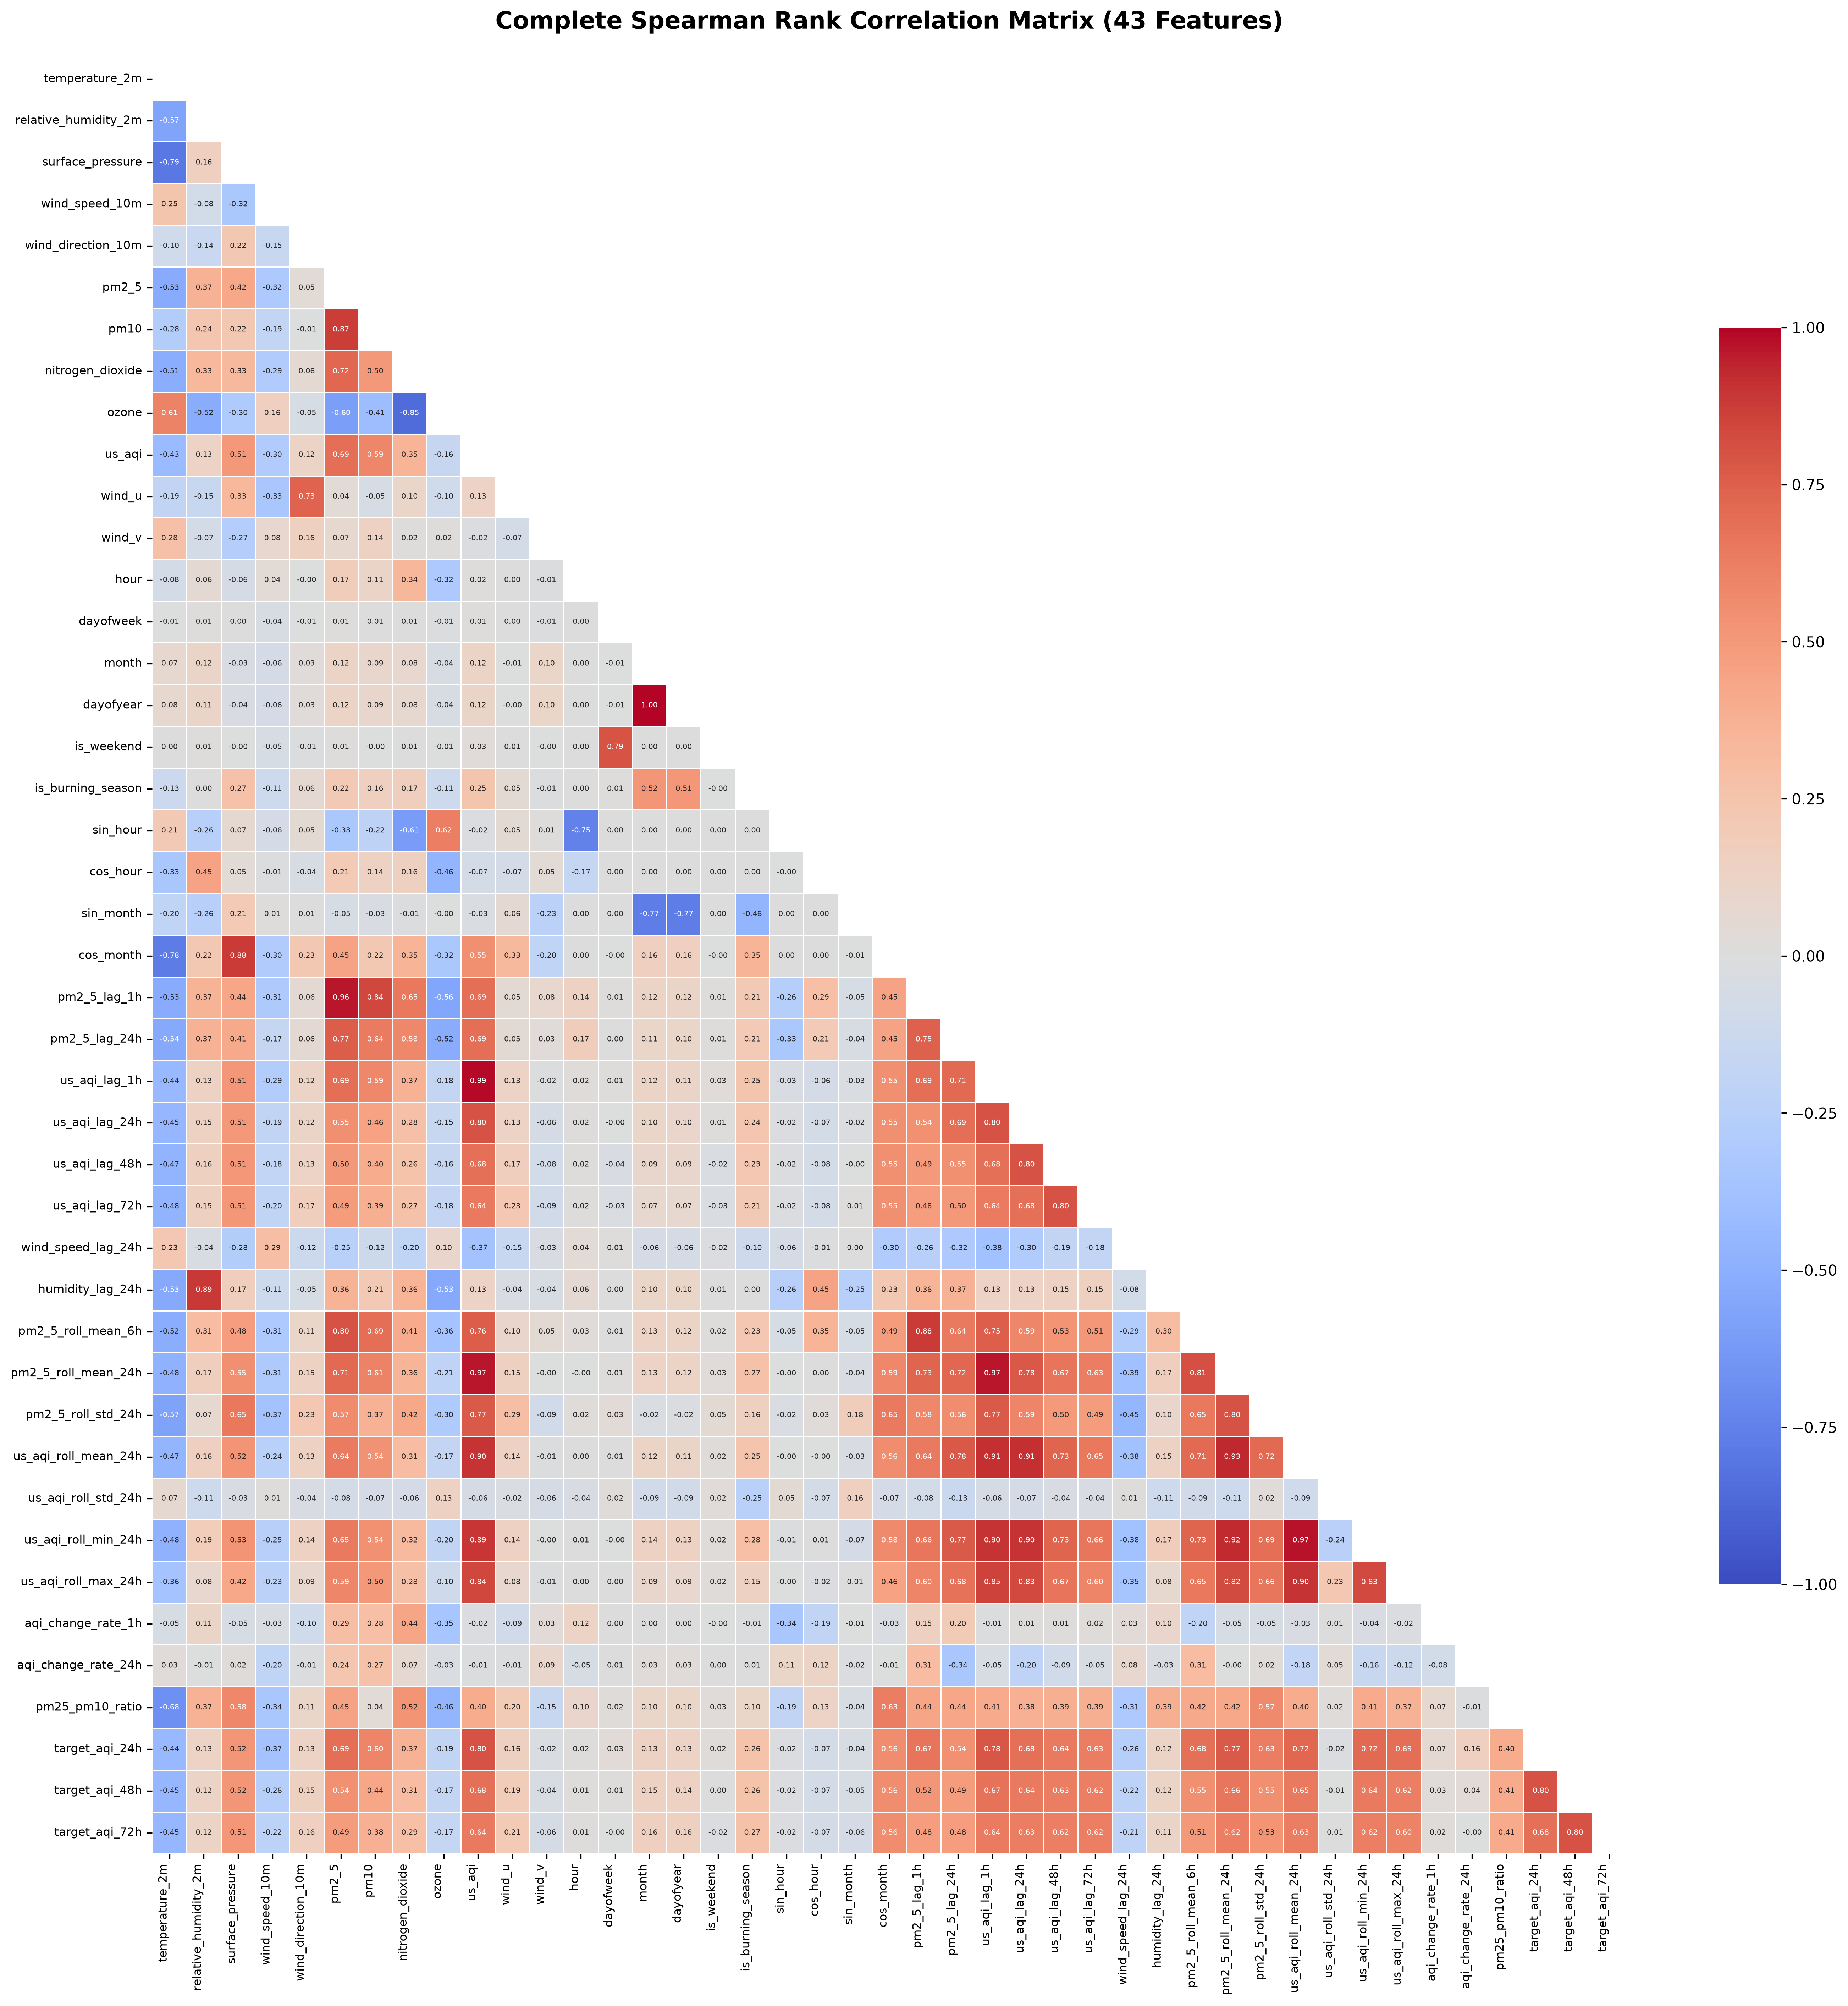
Feature correlation
Full feature correlation matrix
SYSTEM MAP / FROM DATA TO DECISION
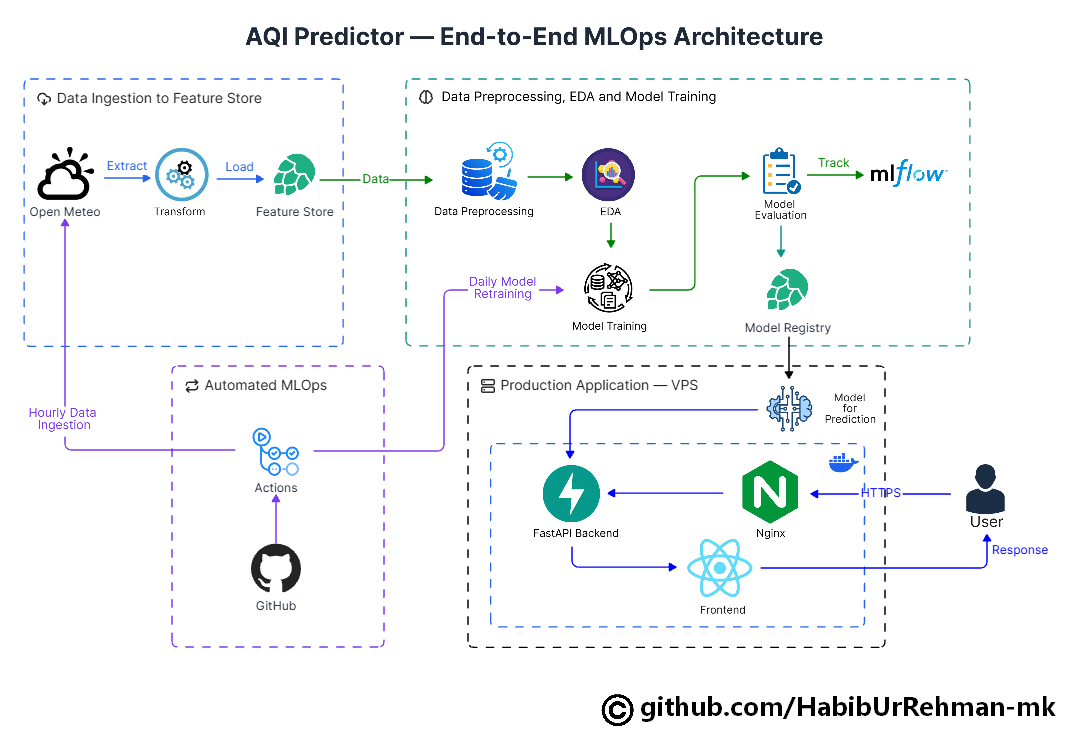
One hourly loop, three horizons.
The production system turns modeled atmospheric data into a forecast that can be read in a browser, without changing the model-serving path.
End-to-end MLOps architecture
01
From Open-Meteo to the browser.
Hourly data ingestion transforms weather and air-quality observations into the Hopsworks feature store. The FastAPI service reads the latest features, loads the registered CatBoost models, and exposes the three horizon predictions through the existing API.
Nginx serves this interface and routes prediction requests to the backend. The frontend keeps the operational view simple: current conditions, pollutants, historical context, and a forecast that can be understood at a glance.
02
Hourly ingestion
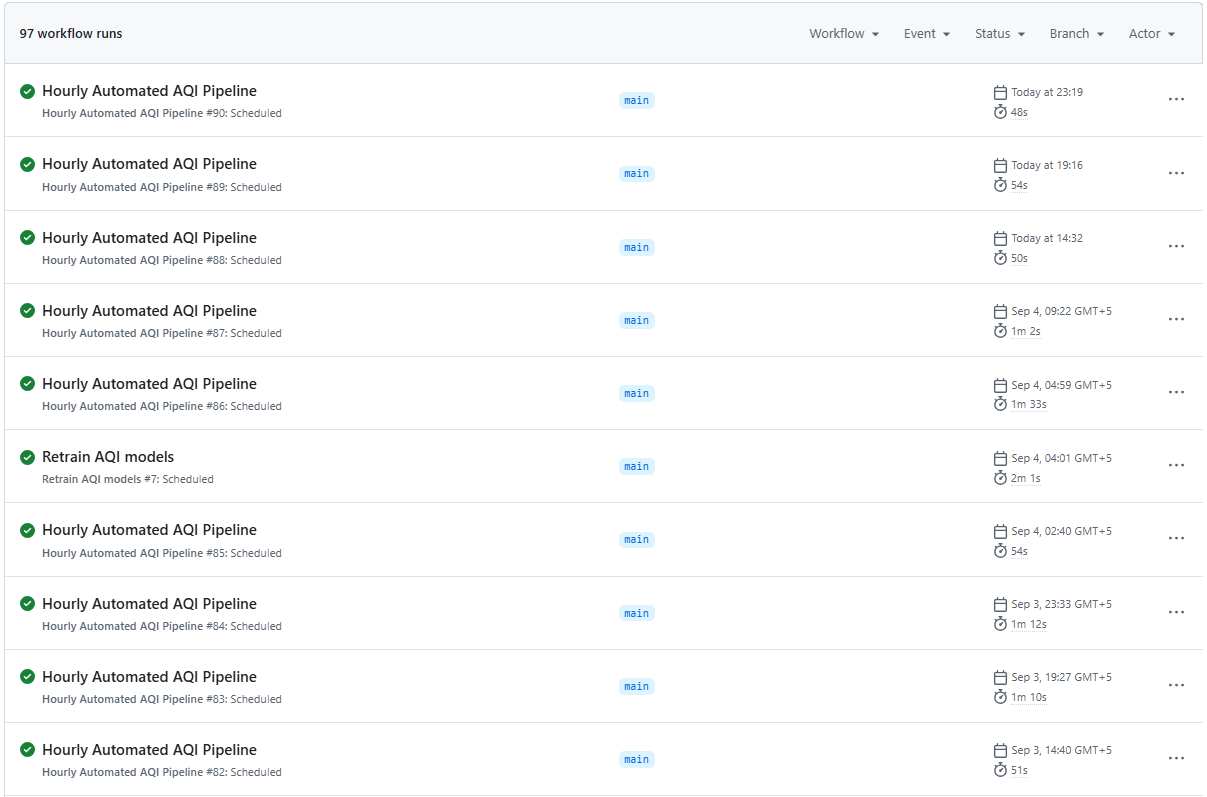
GitHub Actions runs the ingestion and feature-store update every hour. There is no always-on training server in this loop.
03
Daily retraining
The model retraining workflow runs once a day, evaluates candidates with MLflow, and registers the selected horizon models in Hopsworks.
04
Production serving
A DigitalOcean VPS runs FastAPI behind Nginx. The application retrieves predictions on demand while the model cache stays warm in the backend.
Automated pipelines running with Github Actions
05
Automation is part of the product
GitHub Actions keeps the data and model lifecycle moving on a predictable schedule. The deployed application remains focused on serving and explaining the latest result.